Conference Dashboard
Monitor submissions, reviews, author analytics, and reviewer analytics for your conference
The Conference Dashboard provides a real-time overview of your conference's key metrics, submission and review status, track performance, and author demographics.
Accessing the Dashboard
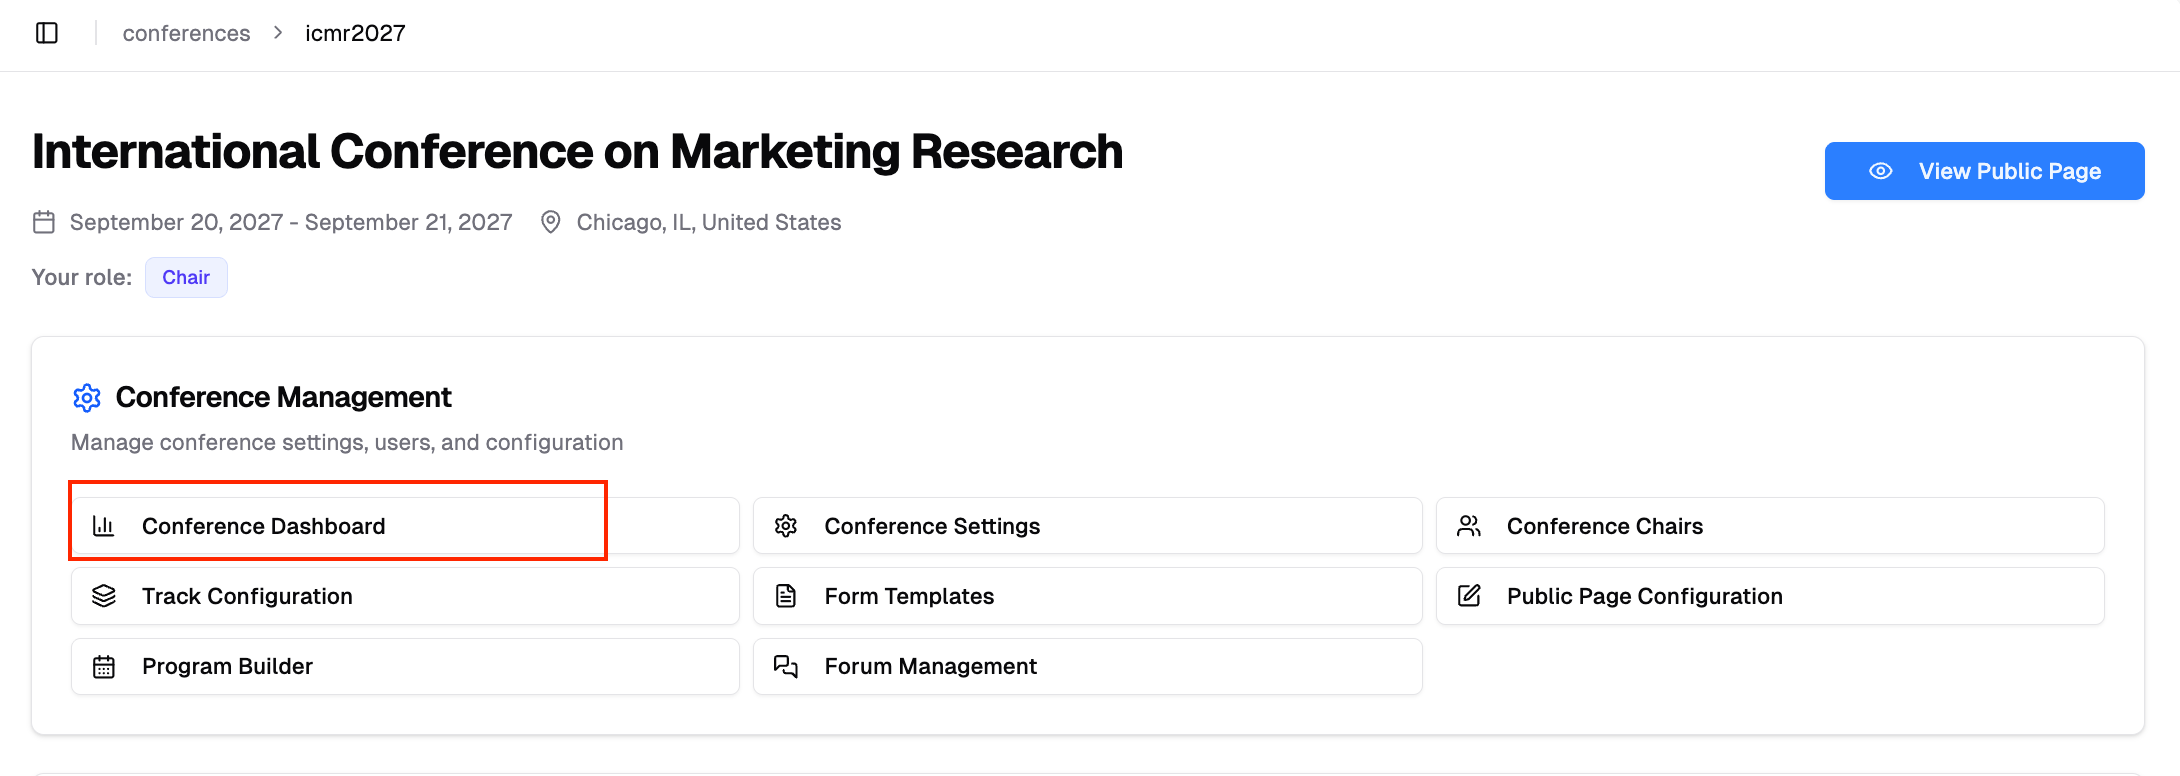
- Go to Conferences in the sidebar, then click "Open Conference" on your conference card
- Under Conference Management, click "Conference Dashboard"
Dashboard Overview
The dashboard is organized into several sections.
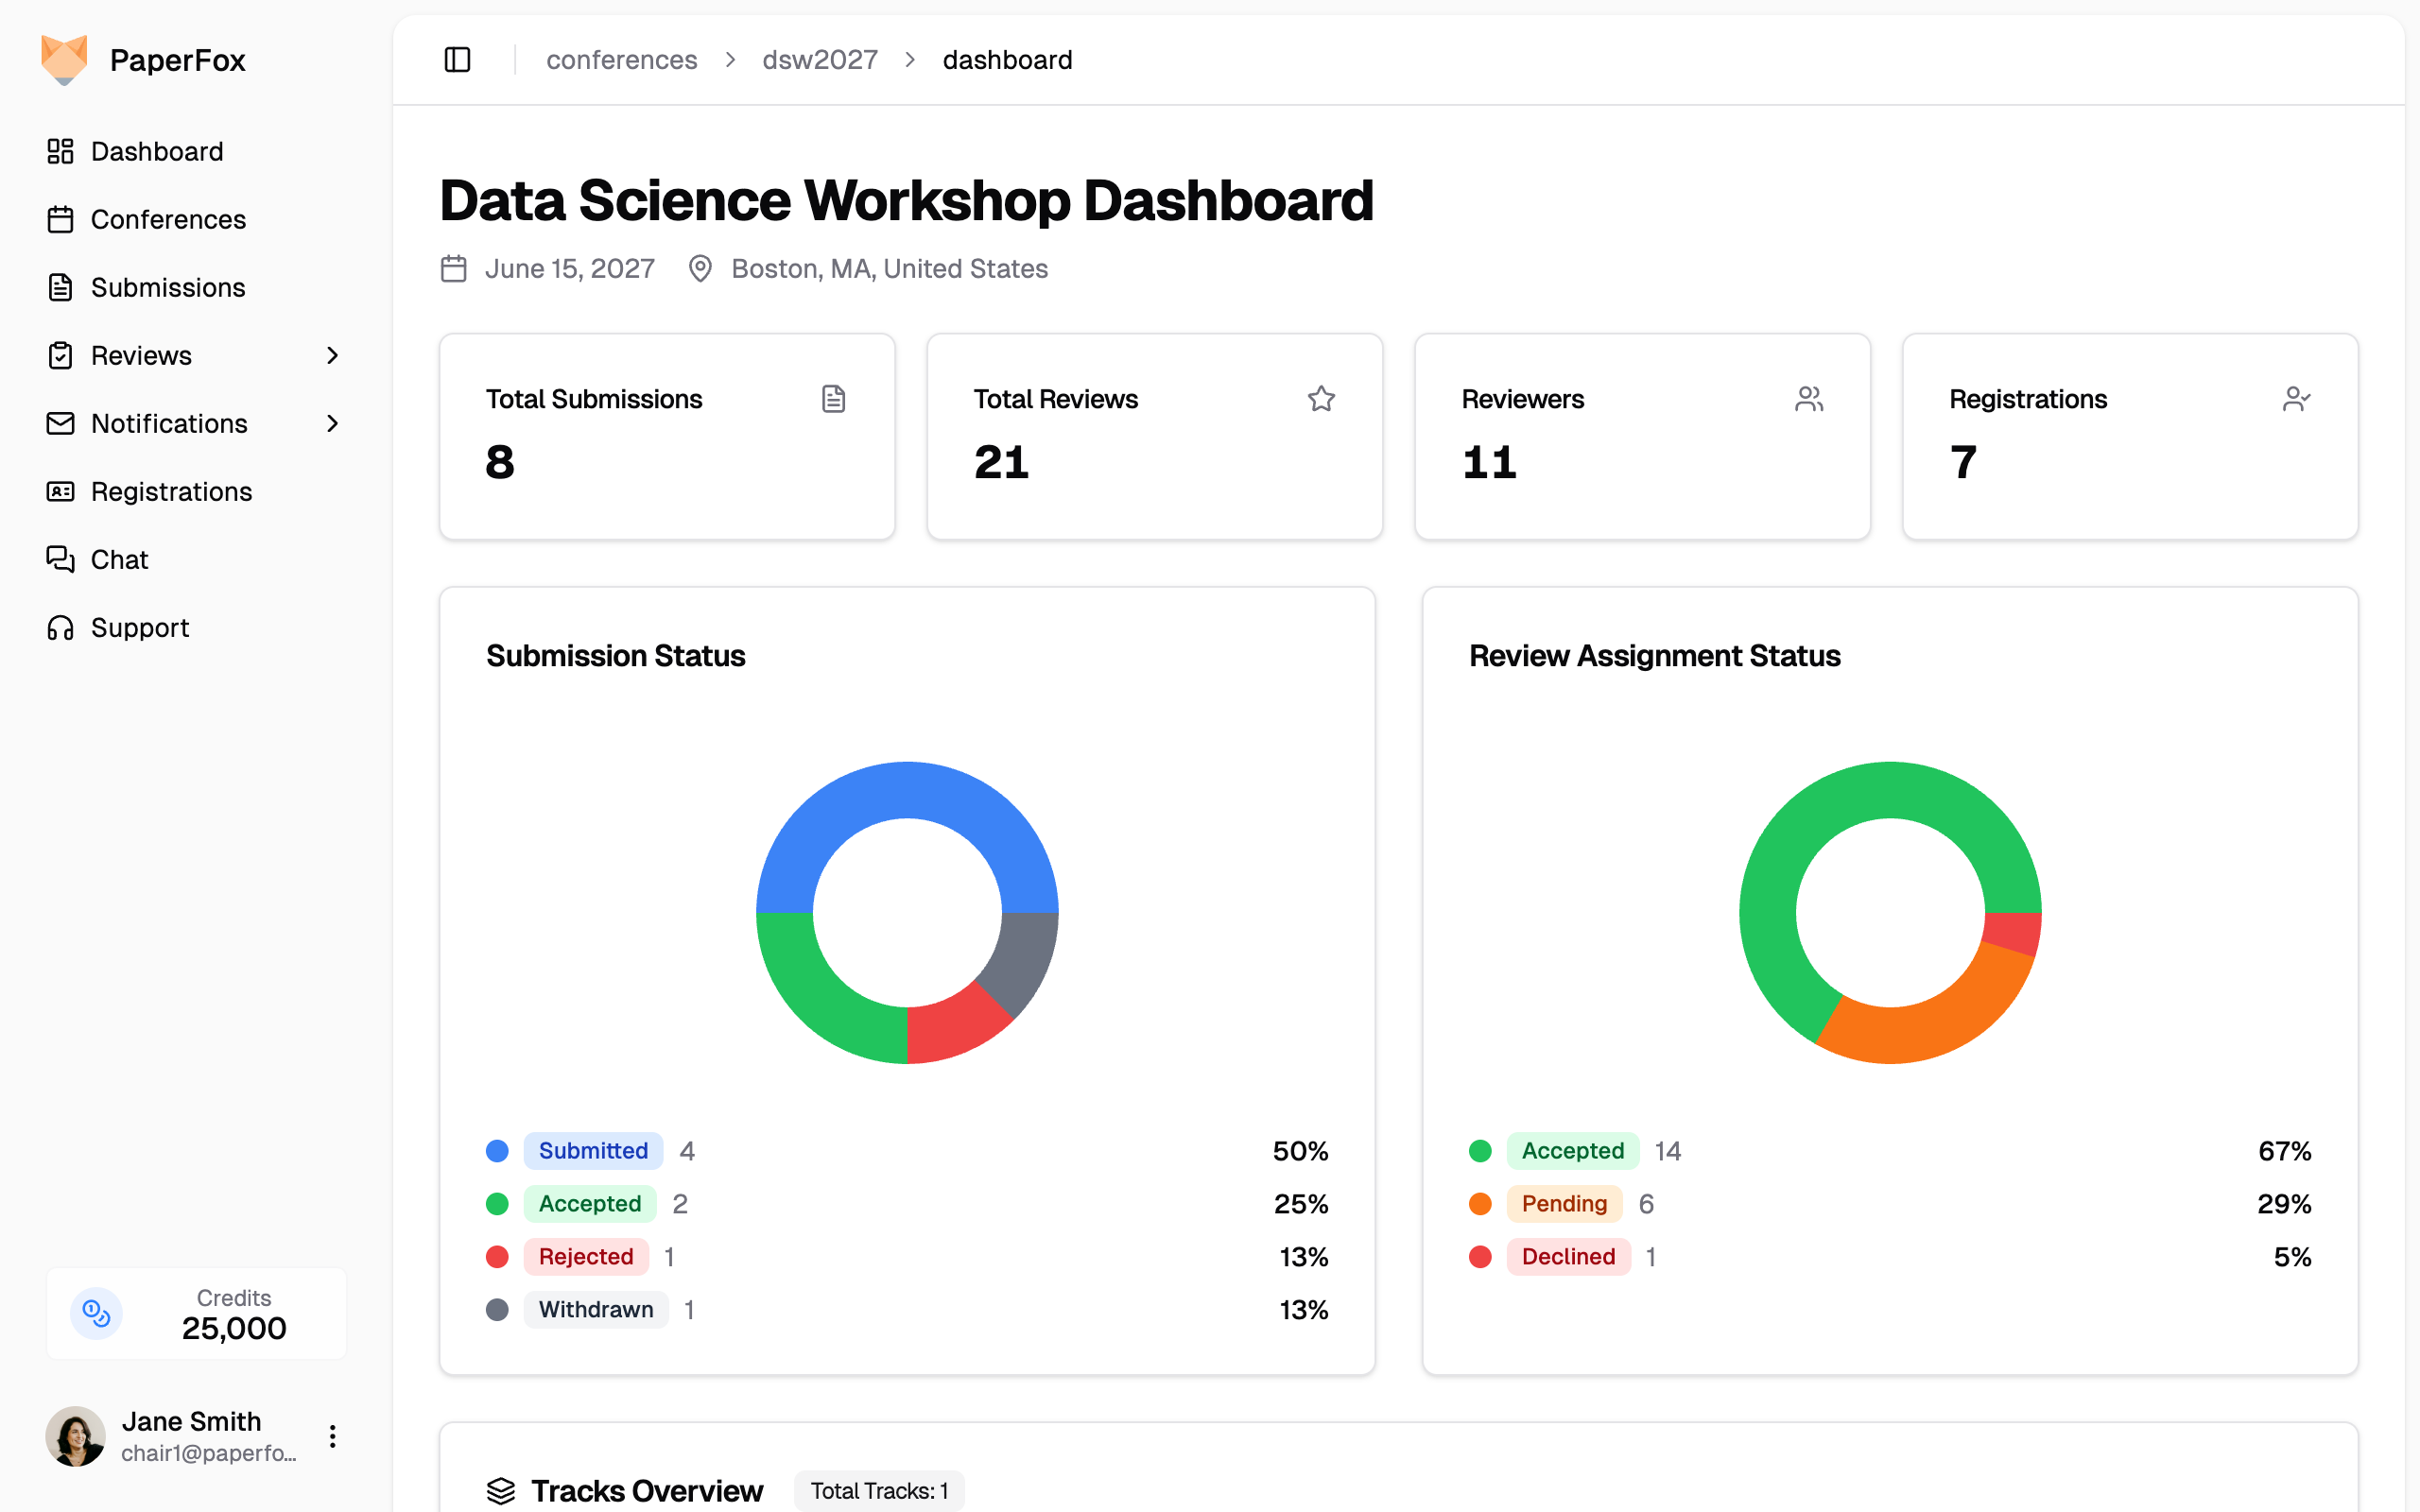
Key Metrics
Four summary cards at the top show:
- Total Submissions — Number of papers submitted across all tracks
- Total Reviews — Number of reviews completed
- Reviewers — Number of registered reviewers
- Registrations — Number of conference registrations
Status Charts
Two donut charts visualize the distribution of:
- Submission Status — Submitted, Under Review, Accepted, Rejected, Withdrawn
- Review Assignment Status — Accepted, Pending, Completed, Declined
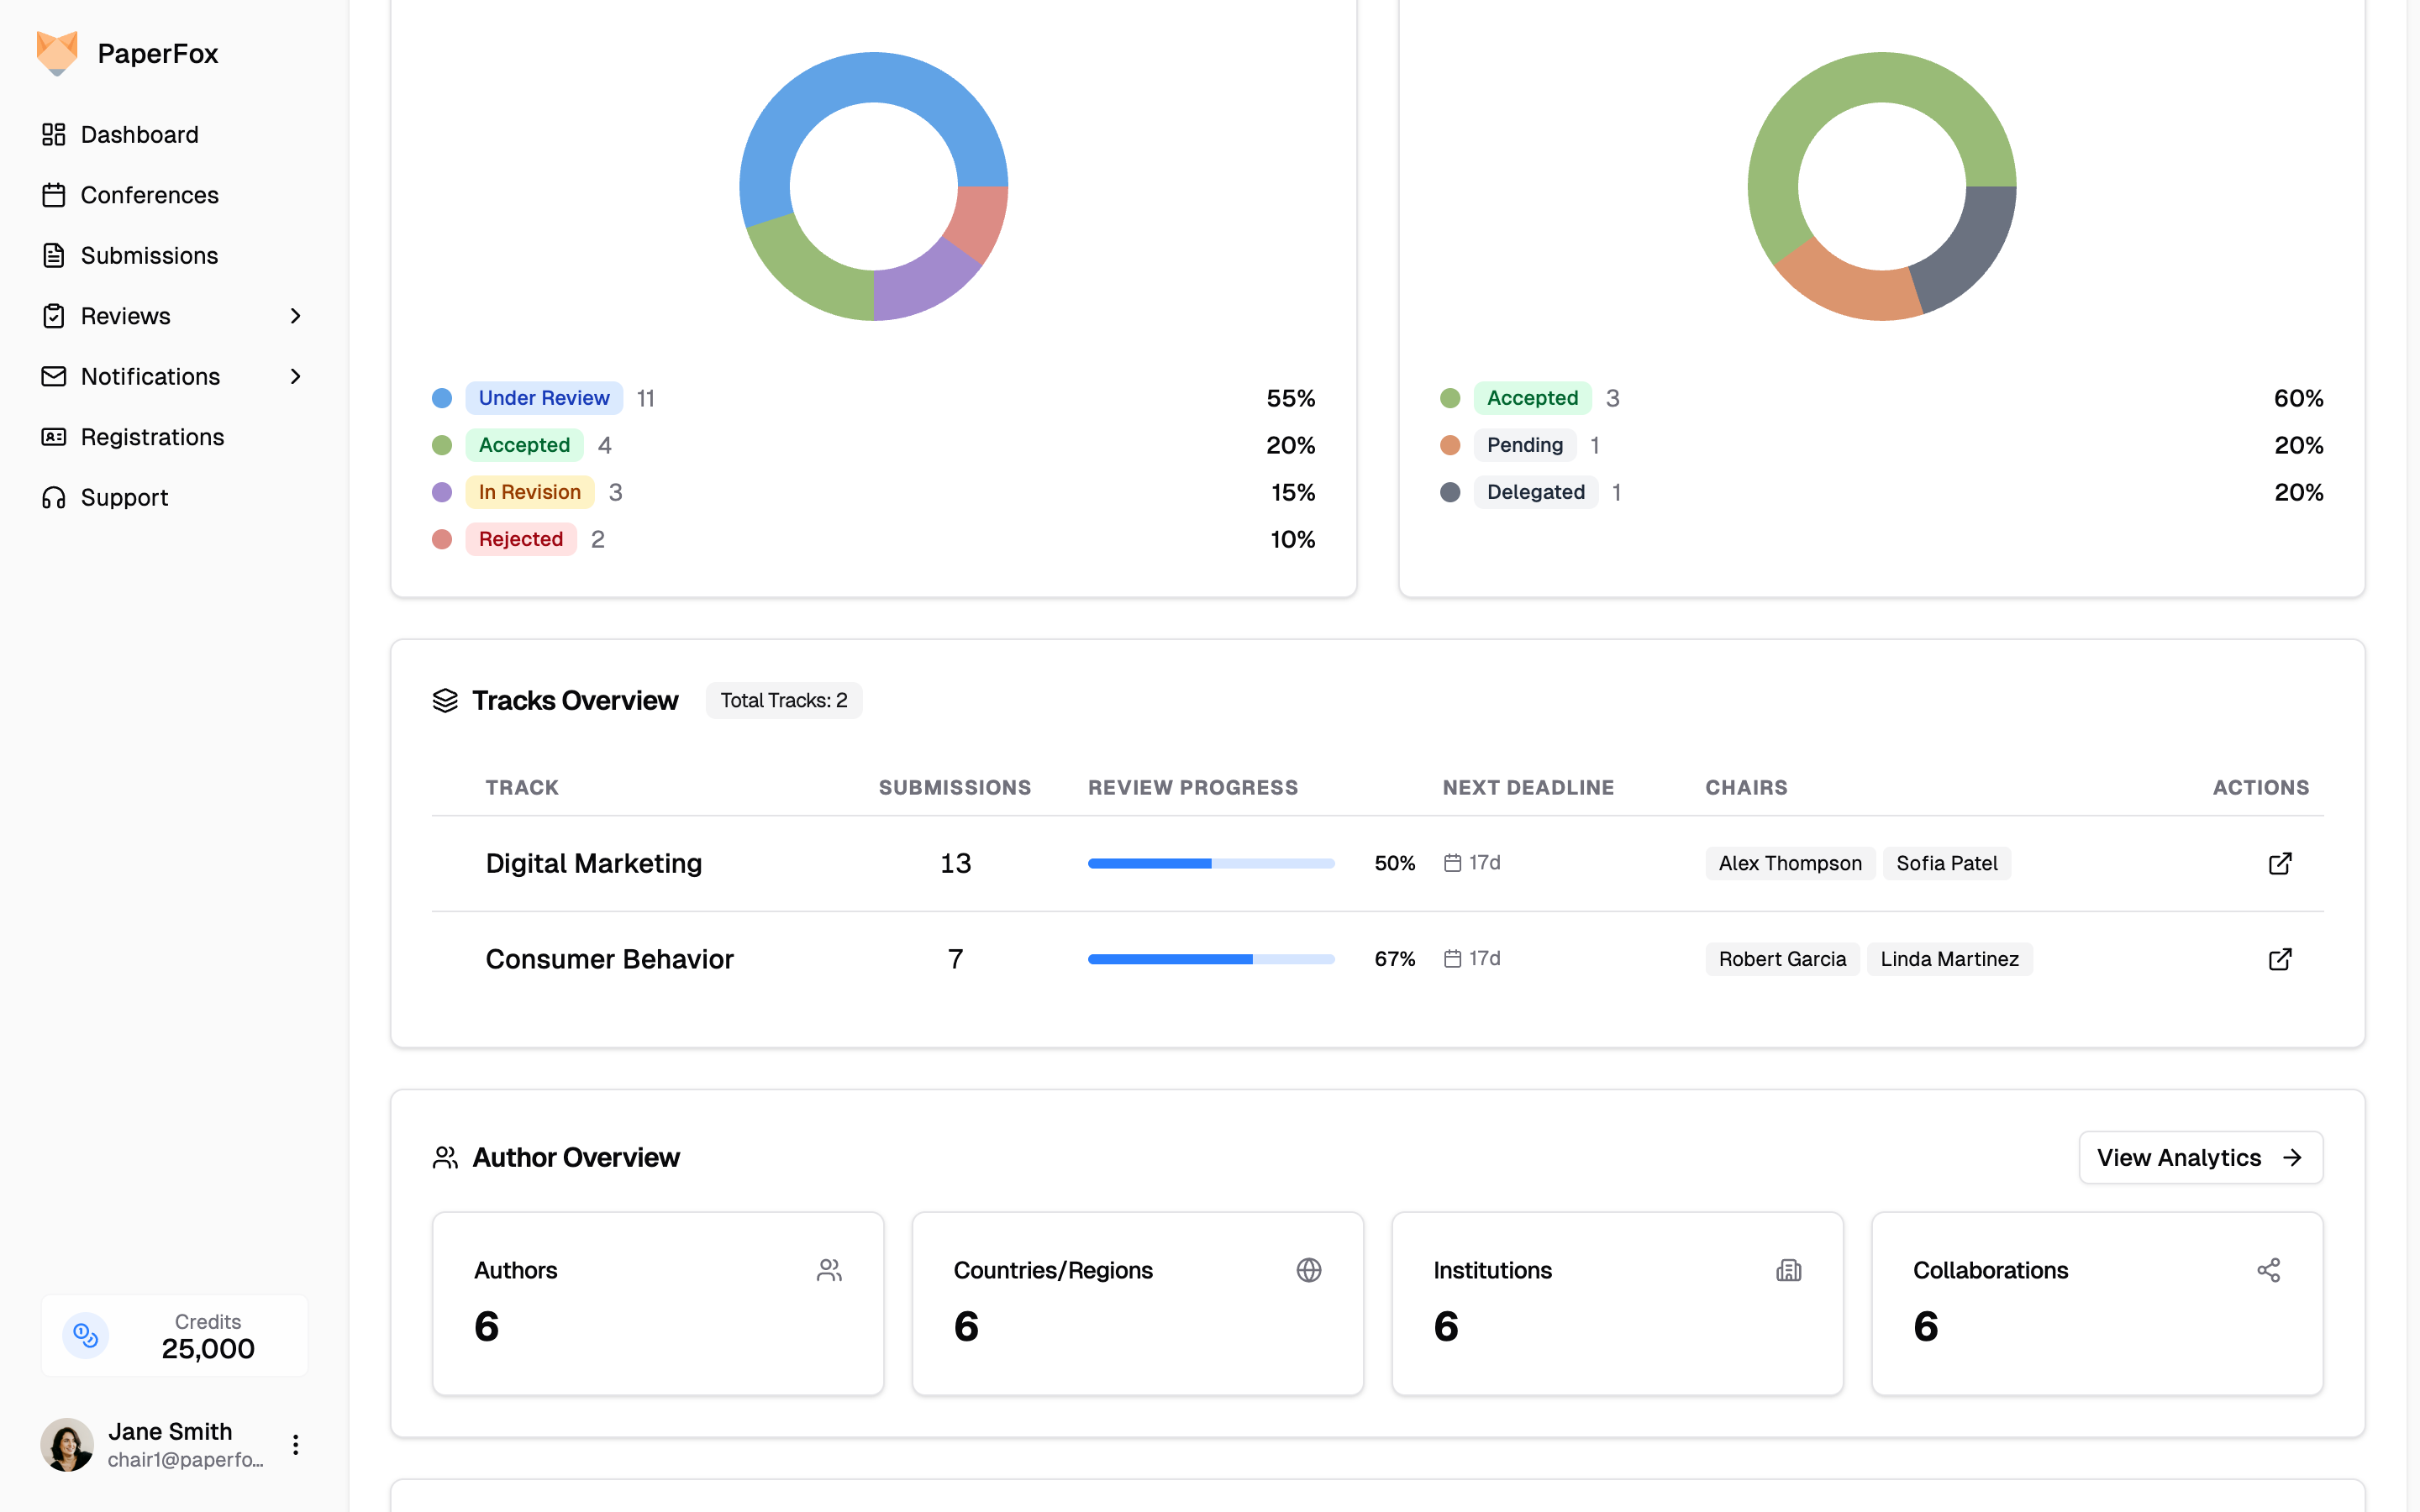
Tracks Overview
A per-track row showing submission count, review progress, the next upcoming review deadline, assigned track chairs, and an alert dot for tracks that need attention (deadlines within 3 days, or expected reviews with none completed yet). Tracks are sorted with the most urgent first.
For conferences with more than 10 tracks, the strip collapses to the top 5 by "needs attention" — click "Show all (N)" to expand.
Single-track conferences hide this section entirely — the conference is the track.
Click the open icon at the end of any row to jump to that track's dashboard.
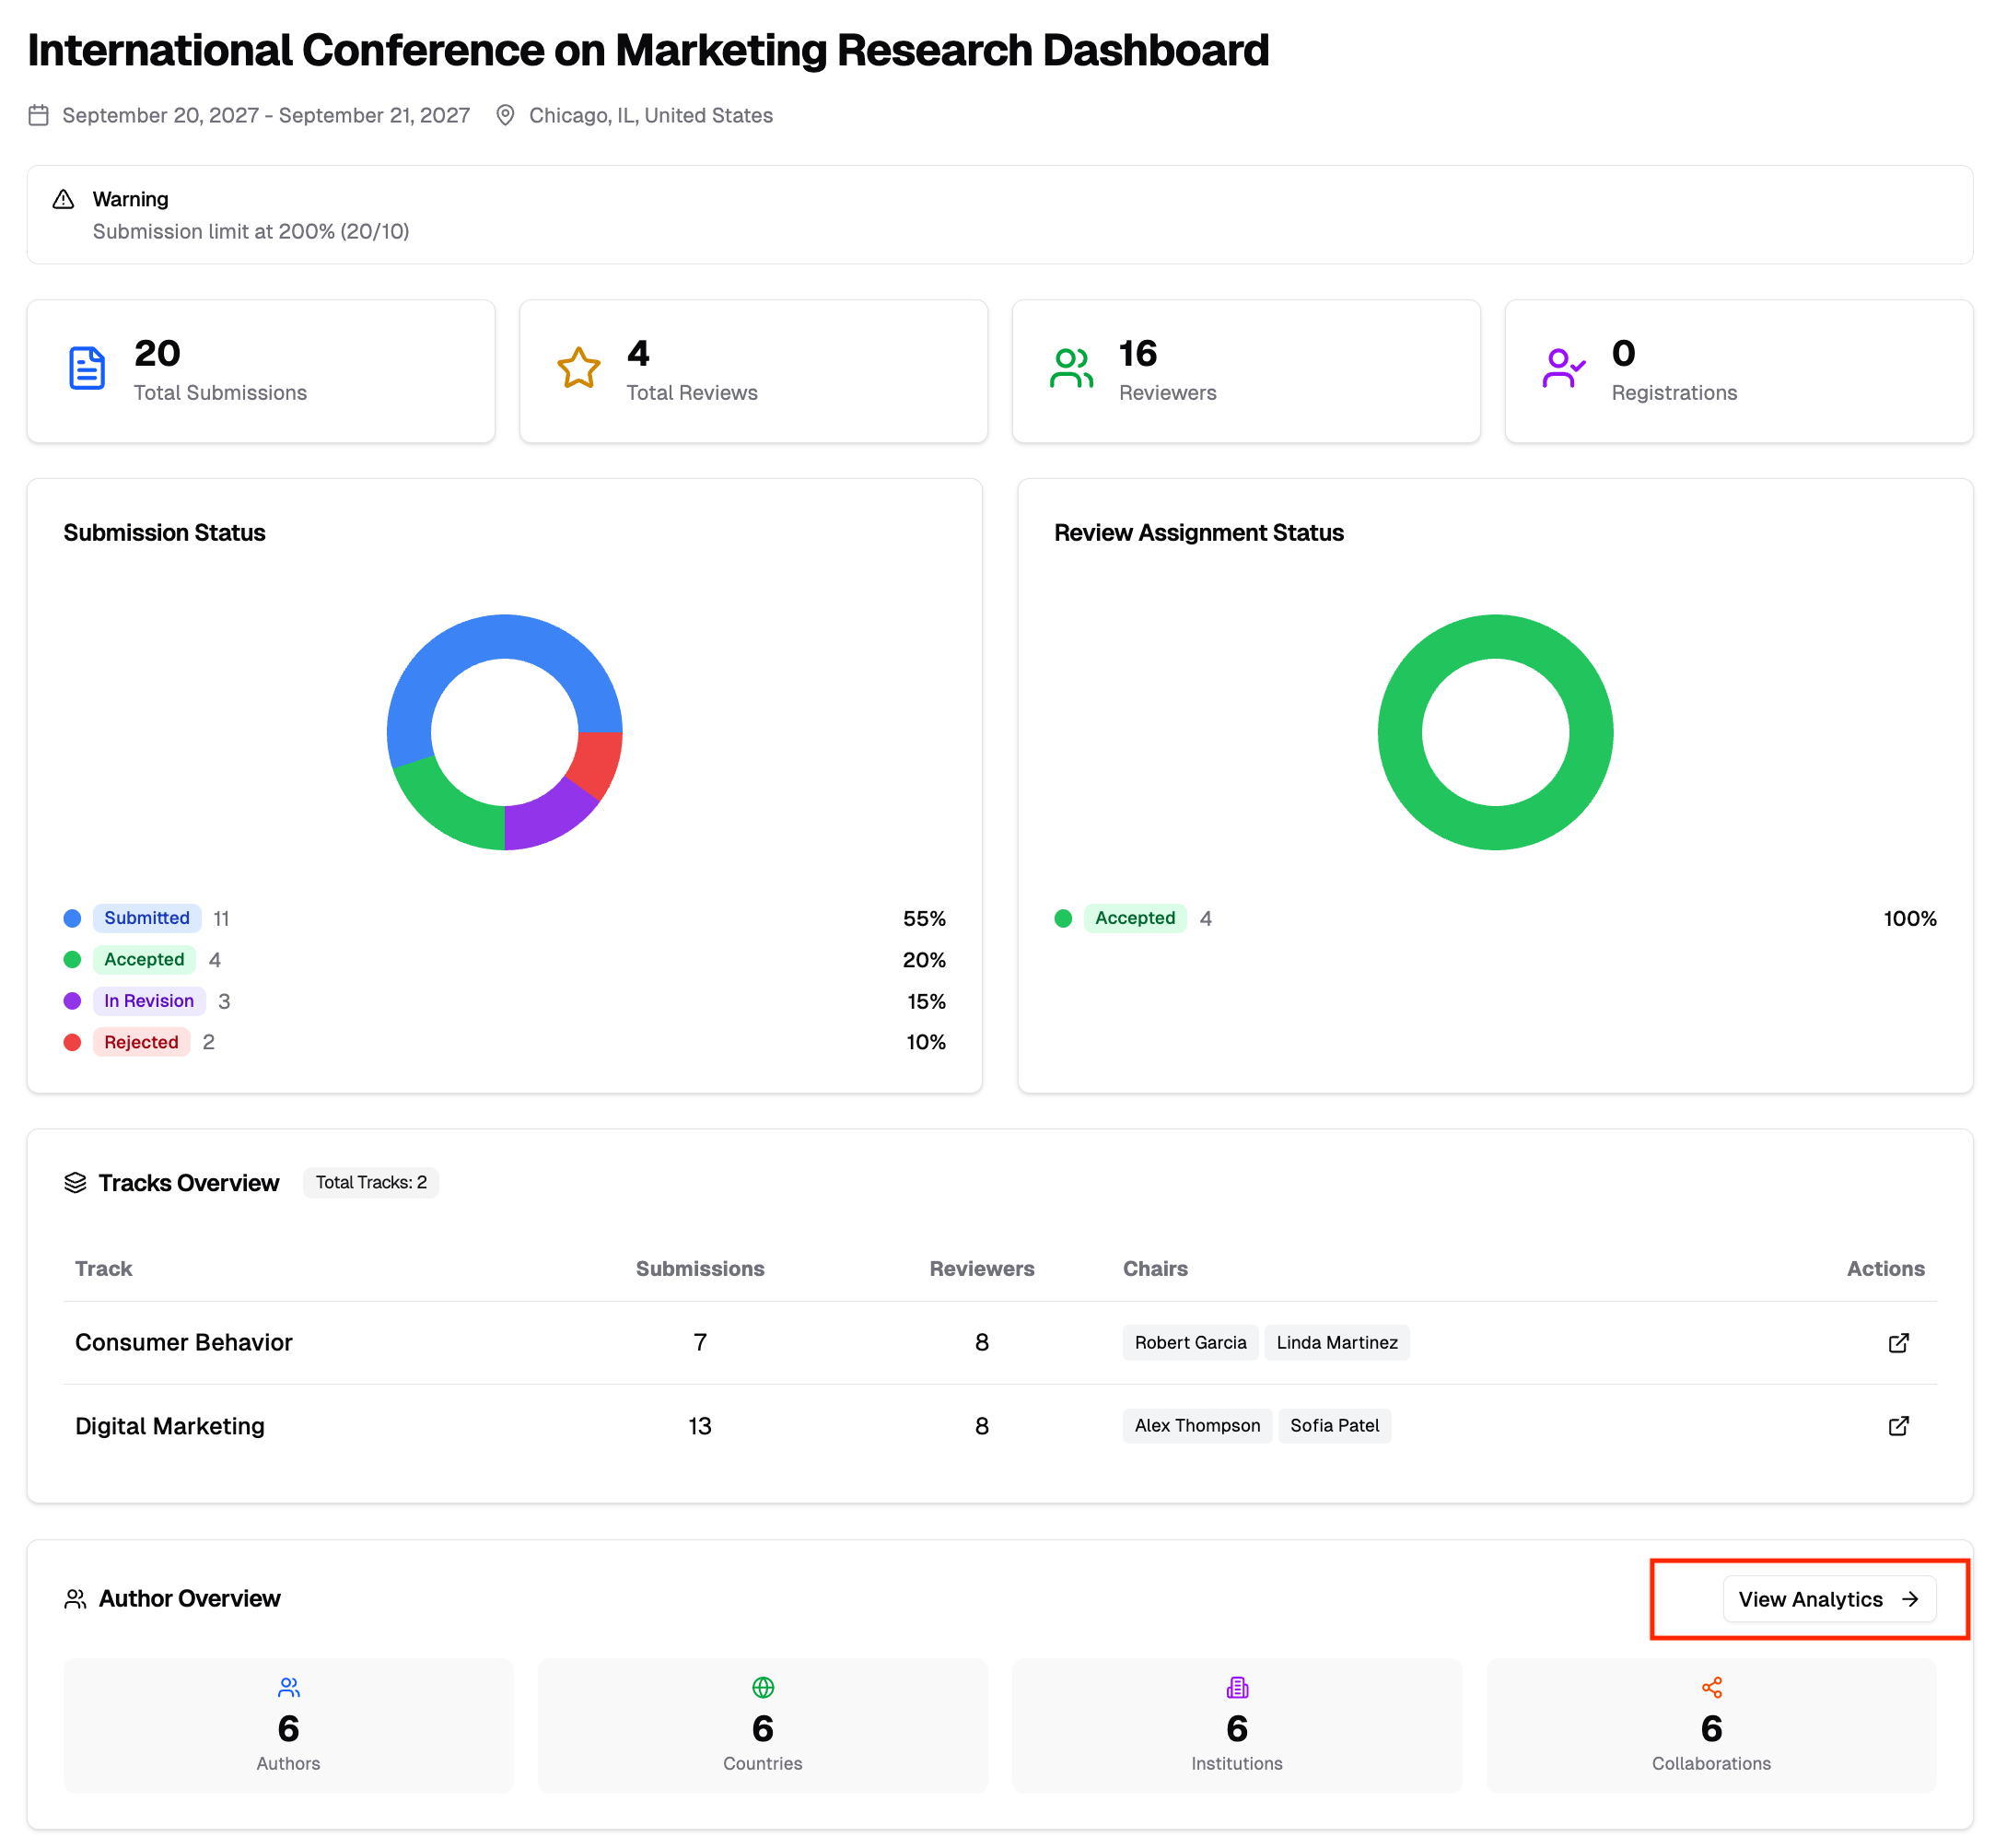
Author Overview
A summary card showing total authors, countries/regions, institutions, and collaborations. Click "View Analytics" to open the detailed Author Analytics page.
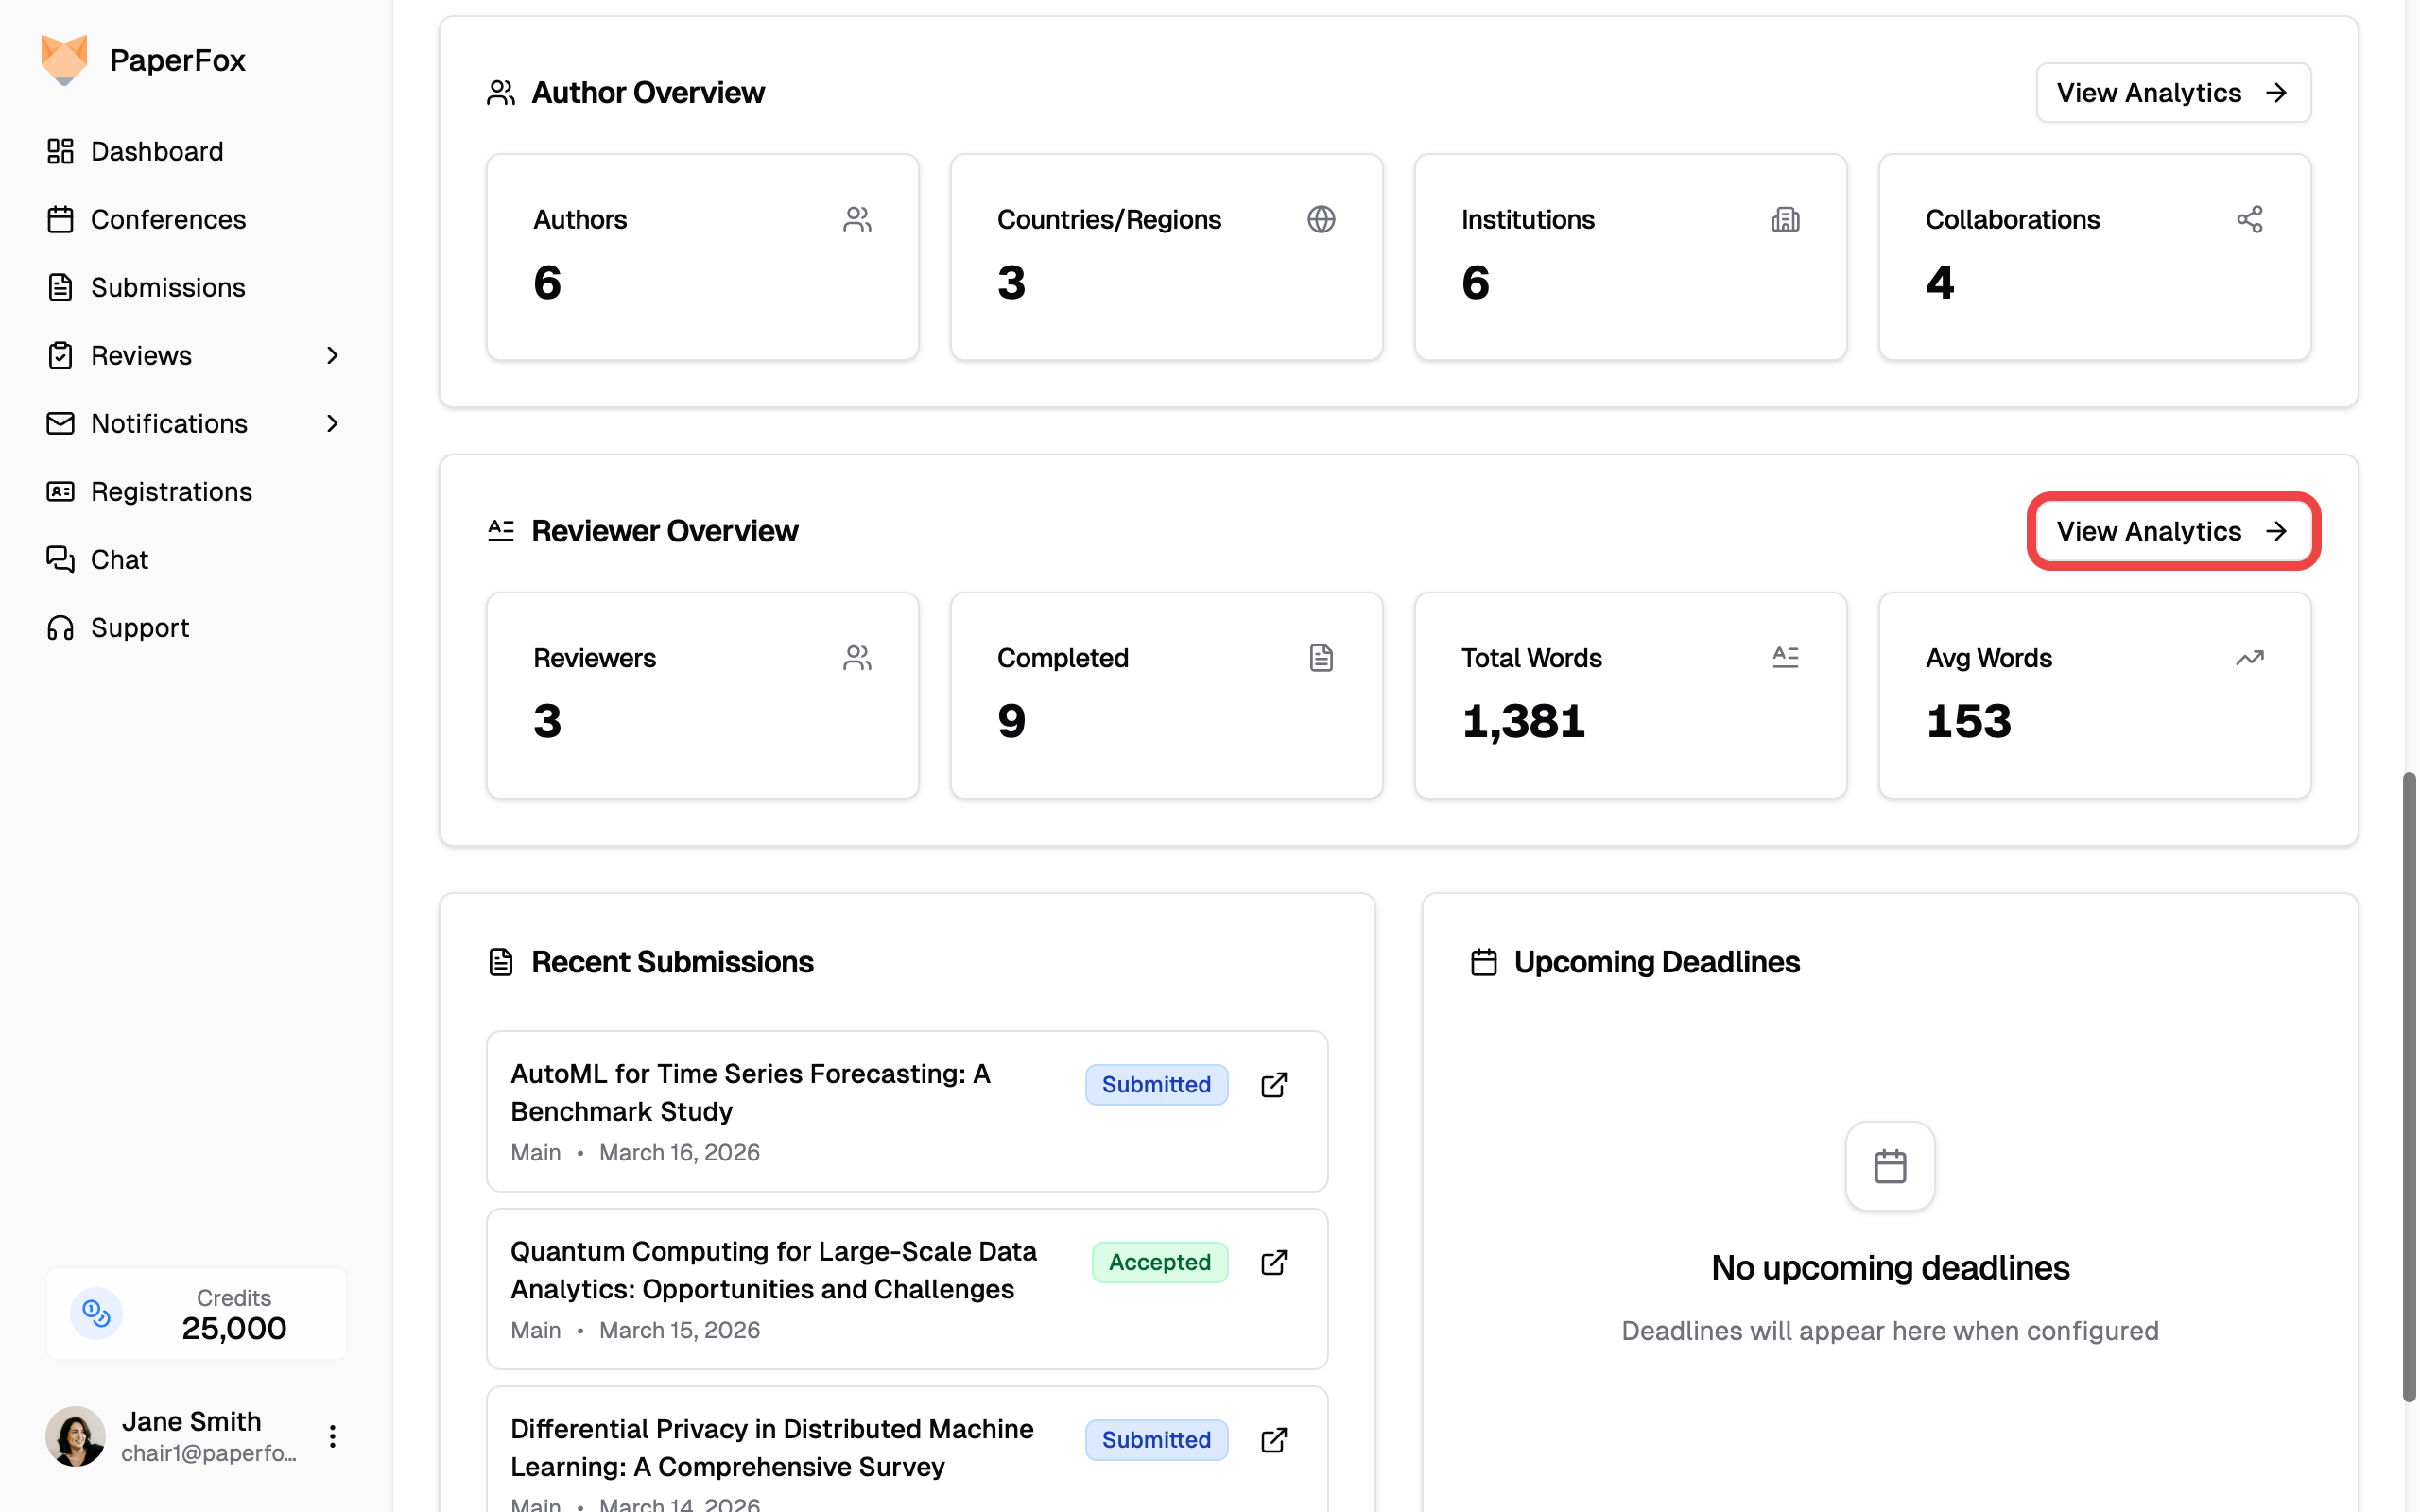
Reviewer Overview
A summary card showing reviewers with completed reviews, completed review count, total and average word count, and average response/turnaround days. Click "View Analytics" to open the detailed Reviewer Analytics page.
Recent Submissions
The latest papers submitted to the conference, with status badges and links to view each submission.
Upcoming Deadlines
Track phases with approaching deadlines, showing urgency indicators so you can stay on top of important dates.
Author Analytics
The Author Analytics page provides detailed insights into who is submitting to your conference.
- From the dashboard, scroll to the Author Overview card
- Click "View Analytics"
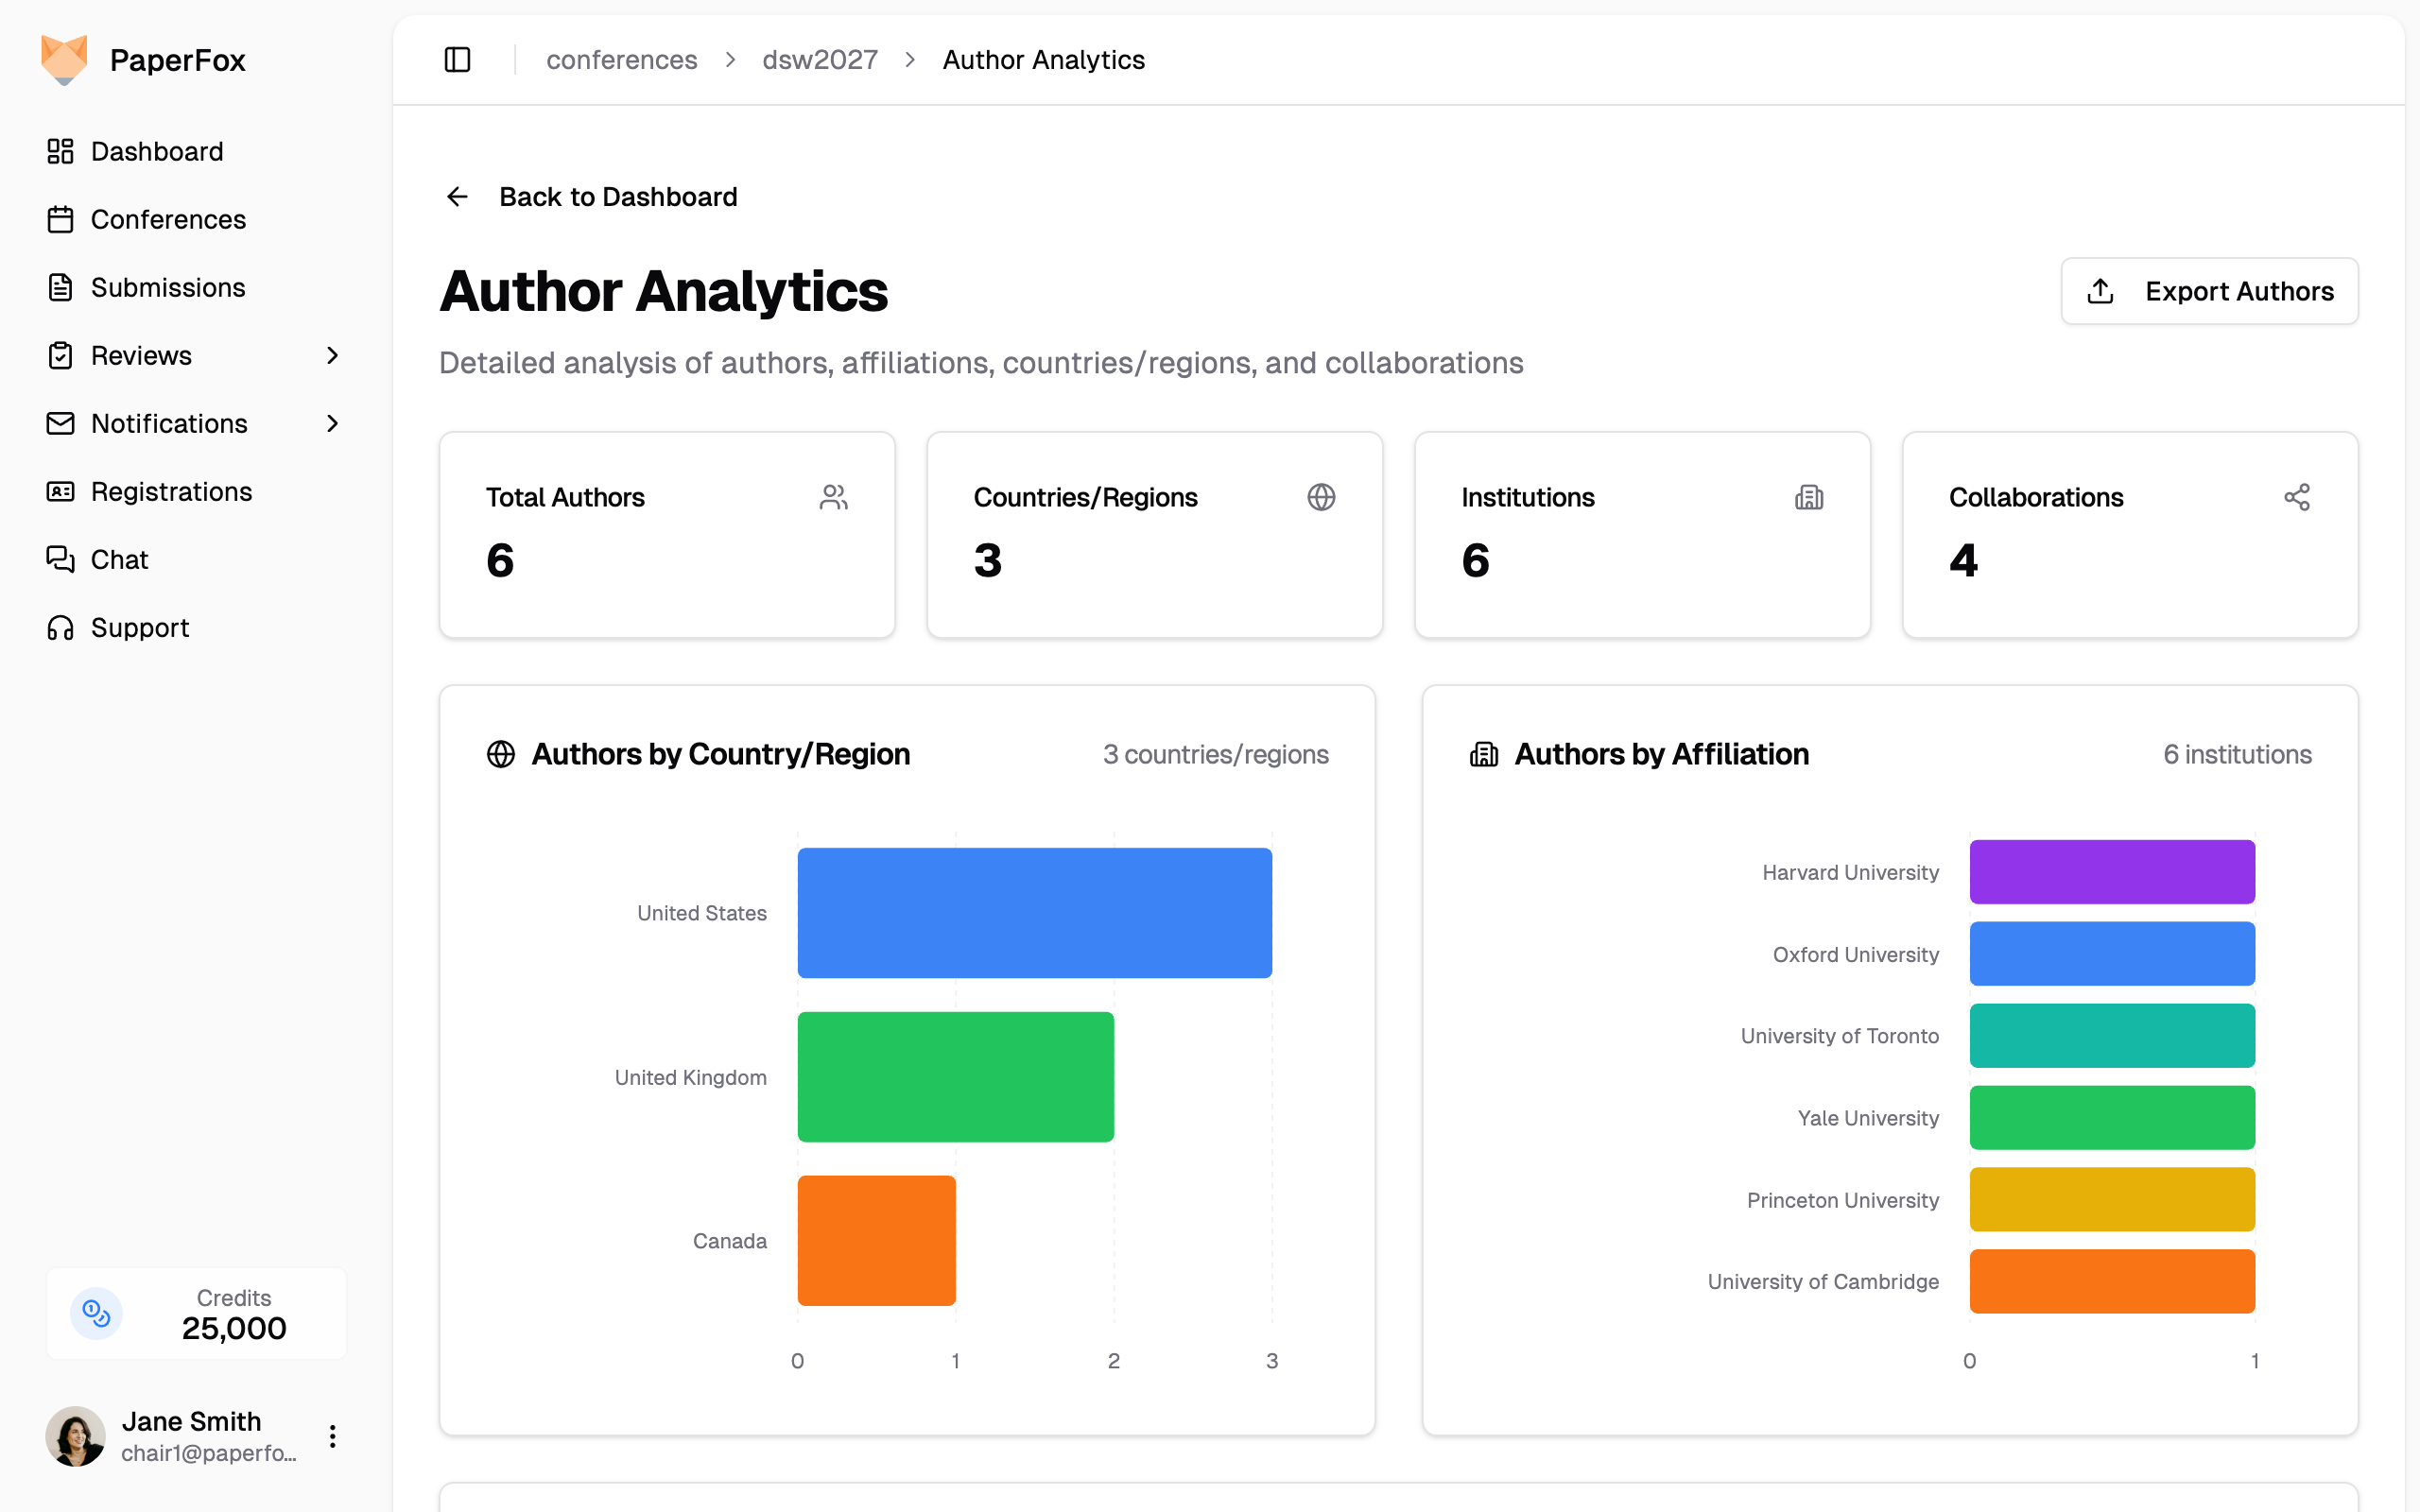
Summary Stats
Four cards at the top show:
- Total Authors — Unique authors across all submissions
- Countries/Regions — Geographic diversity of your author pool
- Institutions — Number of distinct affiliations
- Collaborations — Co-authorship connections between authors
Authors by Country/Region
A horizontal bar chart showing author distribution by country. Helps you understand the geographic reach of your conference.
Authors by Affiliation
A horizontal bar chart showing the top 50 institutions represented, ranked by author count. Affiliation strings are matched verbatim (after whitespace trimming) — variations like "MIT" vs "Massachusetts Institute of Technology" are kept separate.
Co-authorship Network
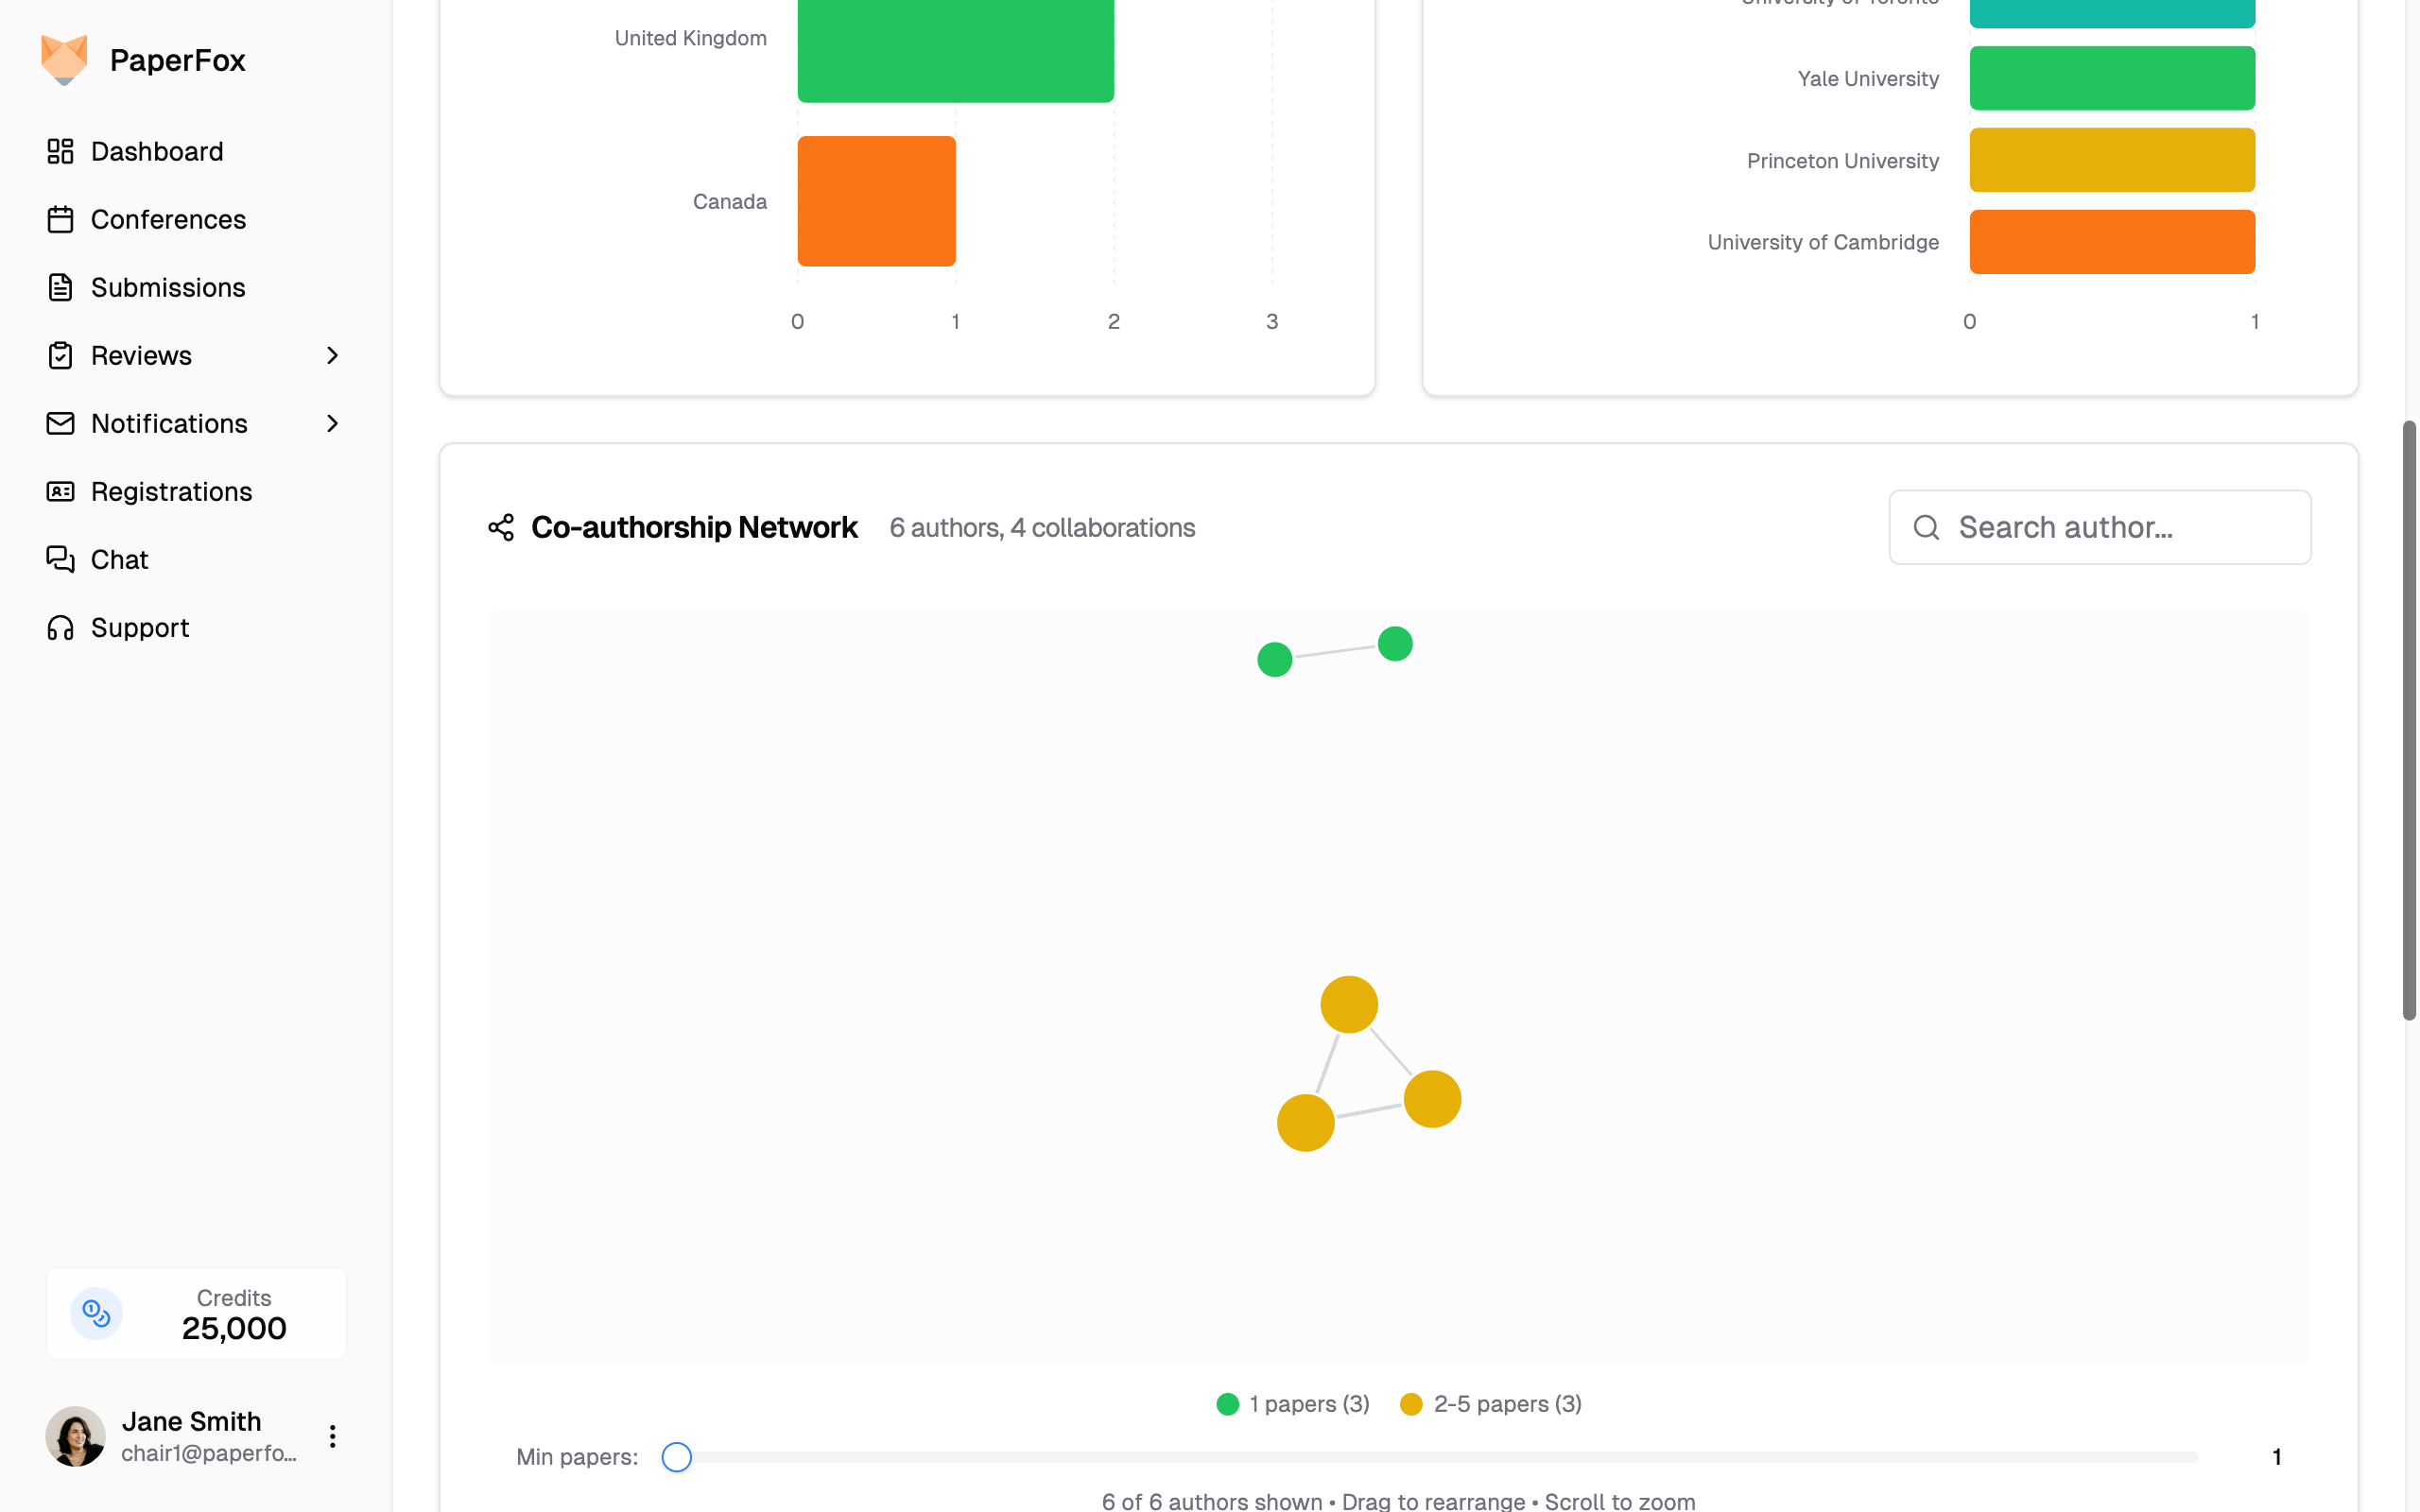
An interactive force-directed graph that visualizes collaboration patterns:
- Node colors indicate paper count — green for 1 paper, yellow for 2-5 papers
- Edges connect co-authors who have collaborated on papers
- Search for specific authors using the search box
- Filter by minimum paper count using the slider
- Drag nodes to rearrange and scroll to zoom
Click on any author node to see their details.
Submissions by Author
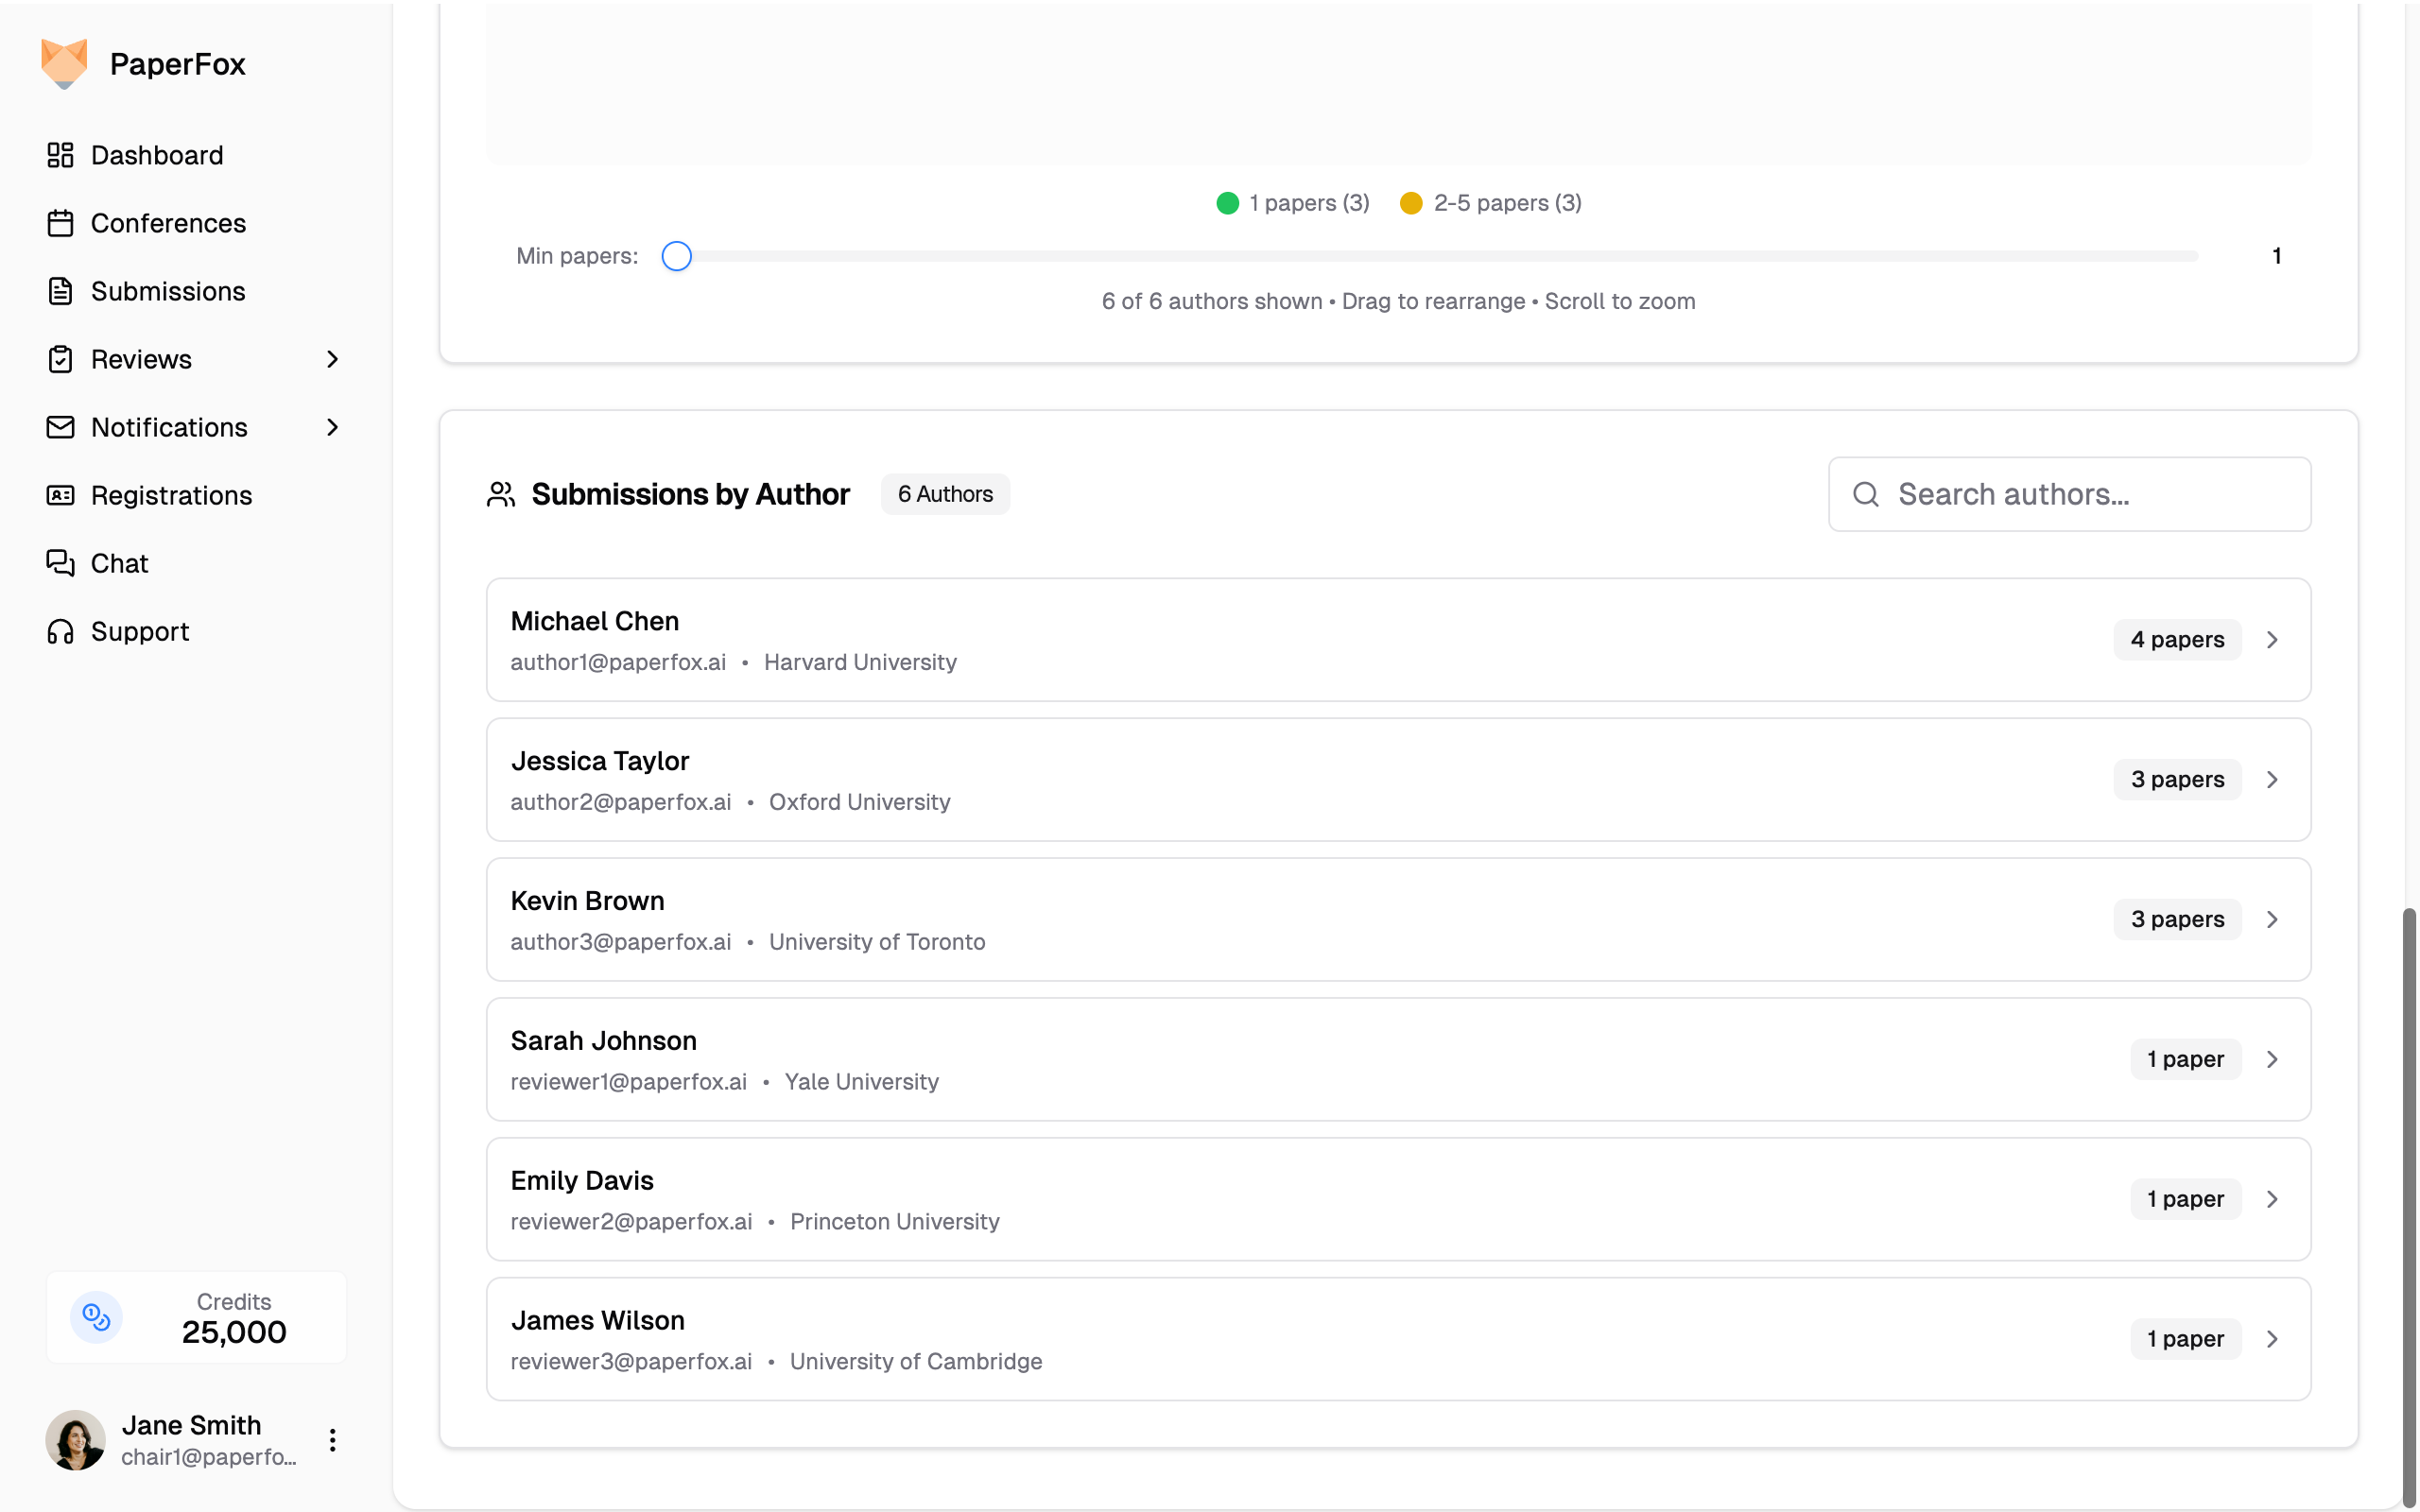
A searchable list of all authors with their paper counts and affiliations. Click the arrow on any author to expand and see their individual submissions with status and track information.
Export
Click the "Export Authors" button at the top of the page to download author data for offline analysis.
Reviewer Analytics
The Reviewer Analytics page helps you evaluate review quality and reviewer responsiveness by analyzing review length and turnaround times.
- From the dashboard, scroll to the Reviewer Overview card
- Click "View Analytics"
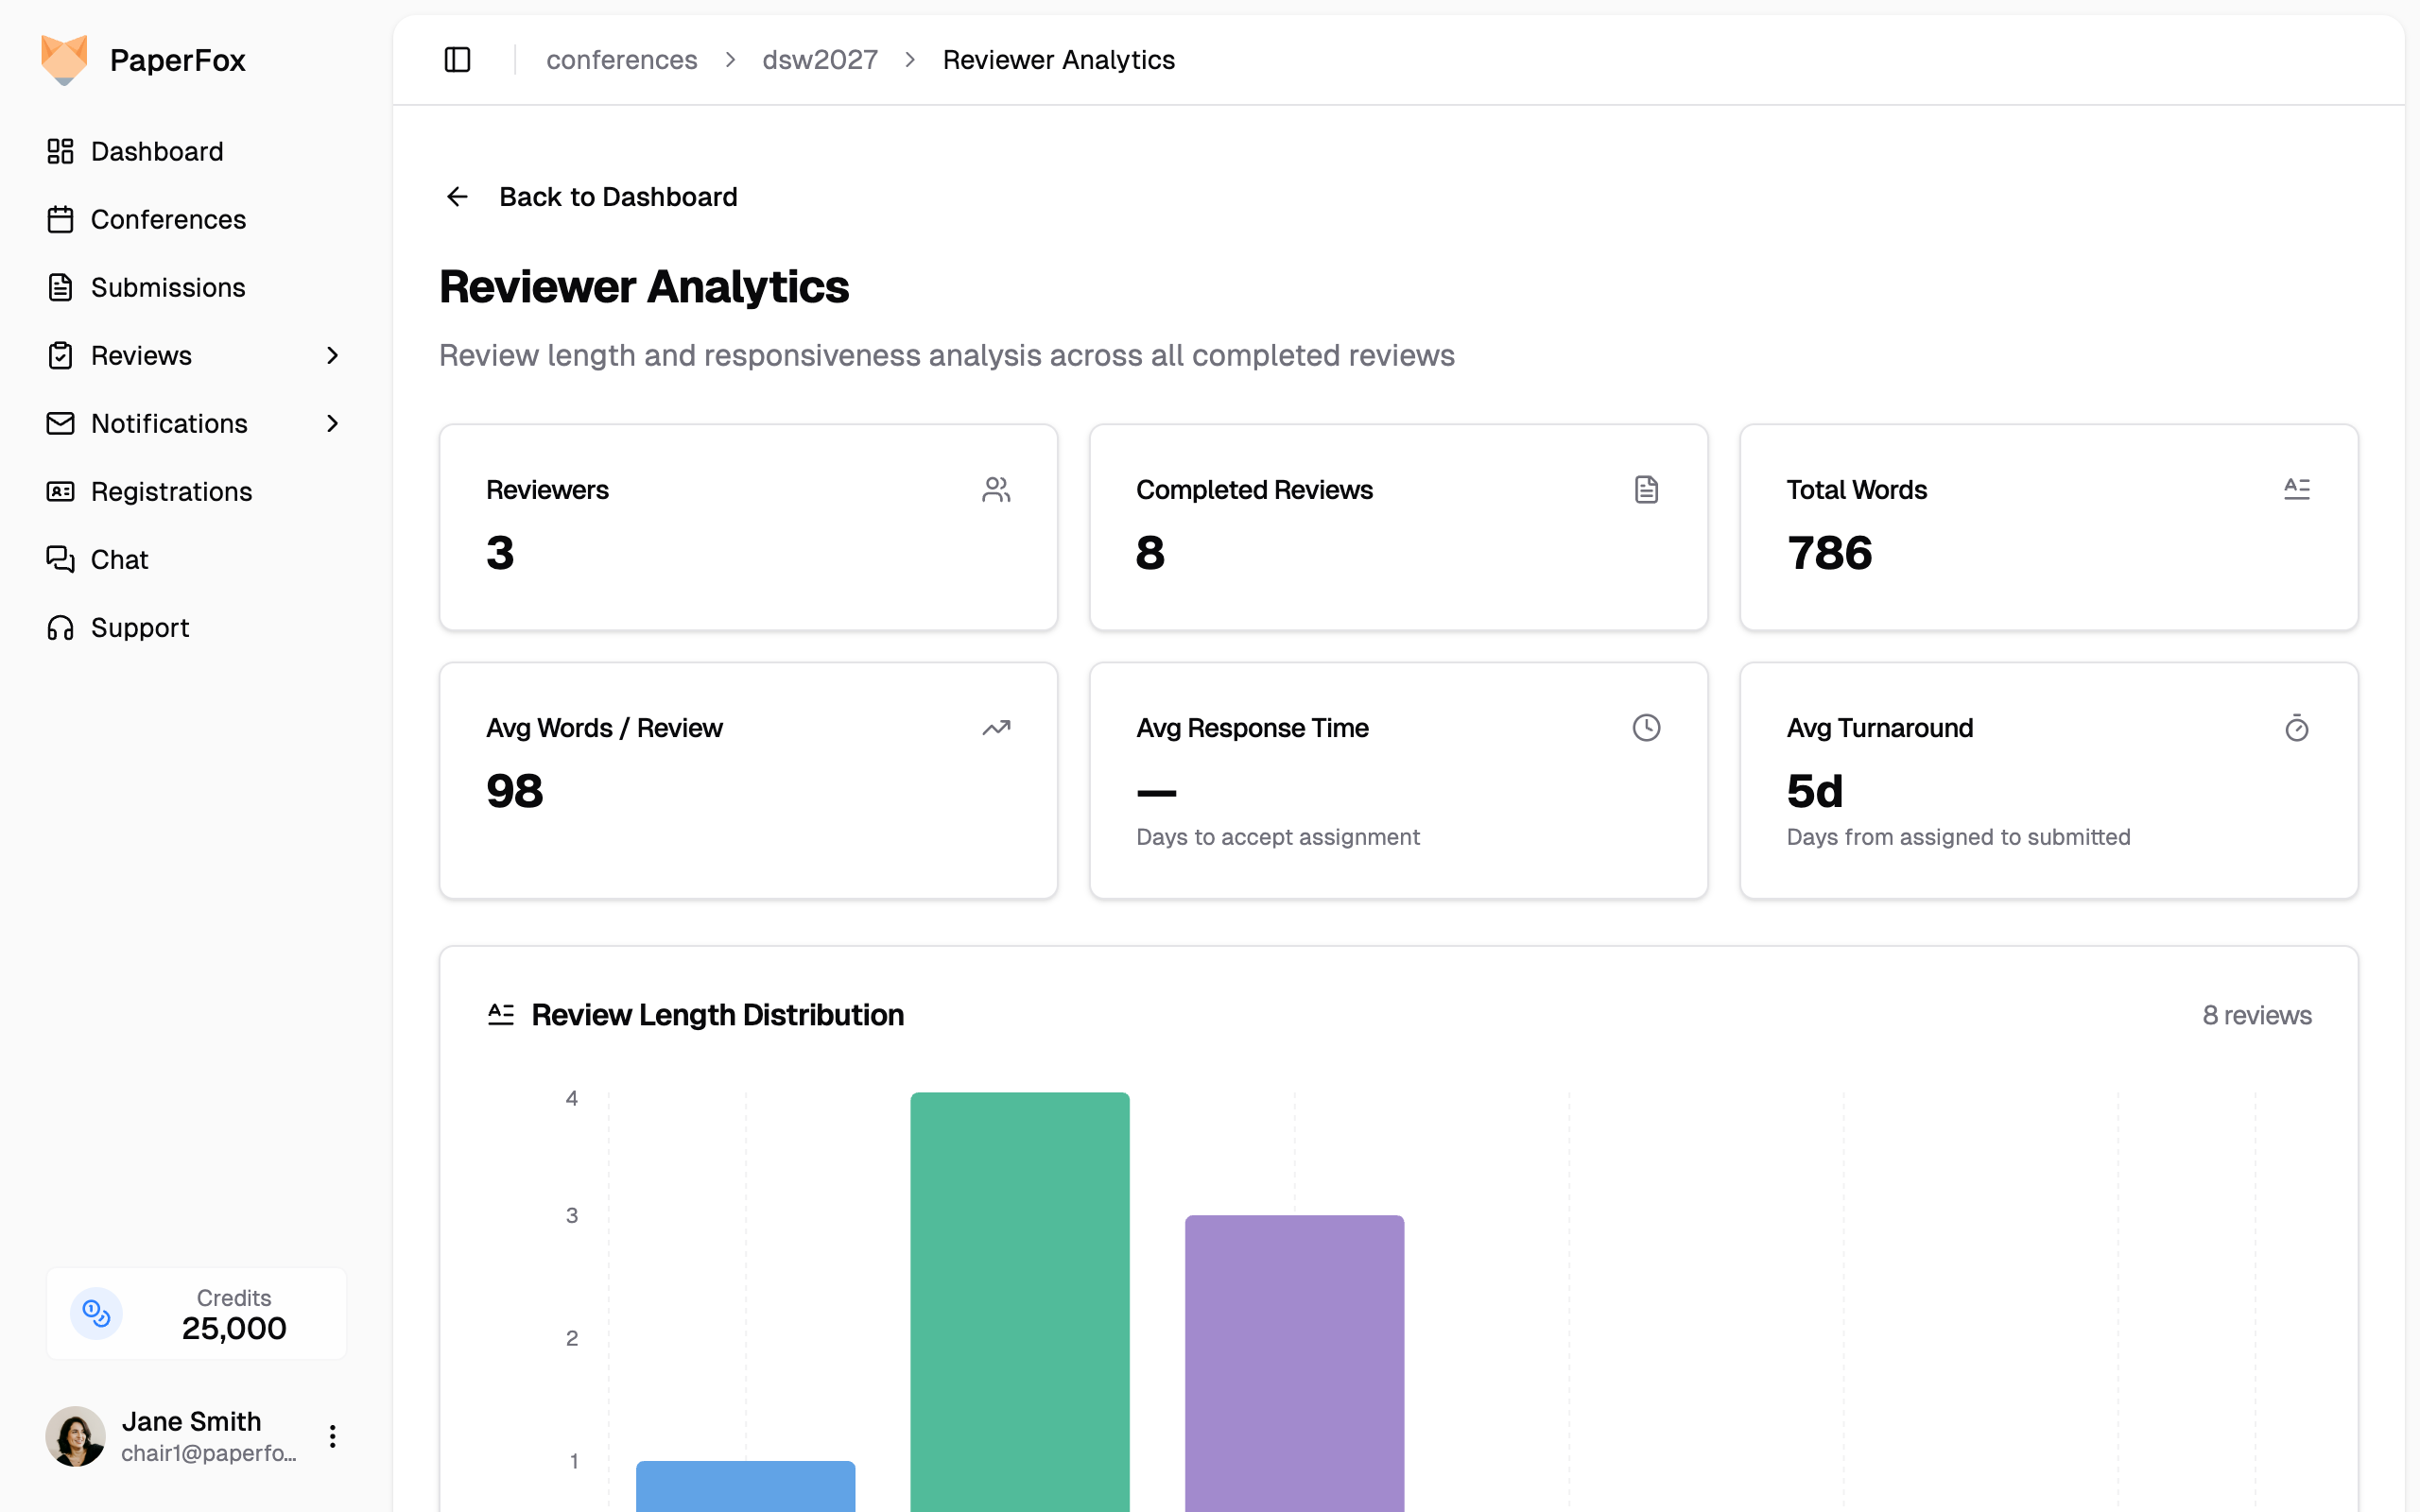
Summary Stats
Six cards at the top show:
- Reviewers — Number of reviewers with completed reviews
- Completed Reviews — Total number of submitted reviews
- Total Words — Combined word count across all reviews
- Avg Words / Review — Average review length
- Avg Response Time — Average days reviewers take to accept their assignment
- Avg Turnaround — Average days from assignment to review submission
Review Length Distribution
A bar chart showing how many reviews fall into each word count range (0–50, 51–100, 101–200, 201–500, 501–1000, 1000+). Helps you spot reviewers who may be writing overly brief reviews.
Reviewer Rankings
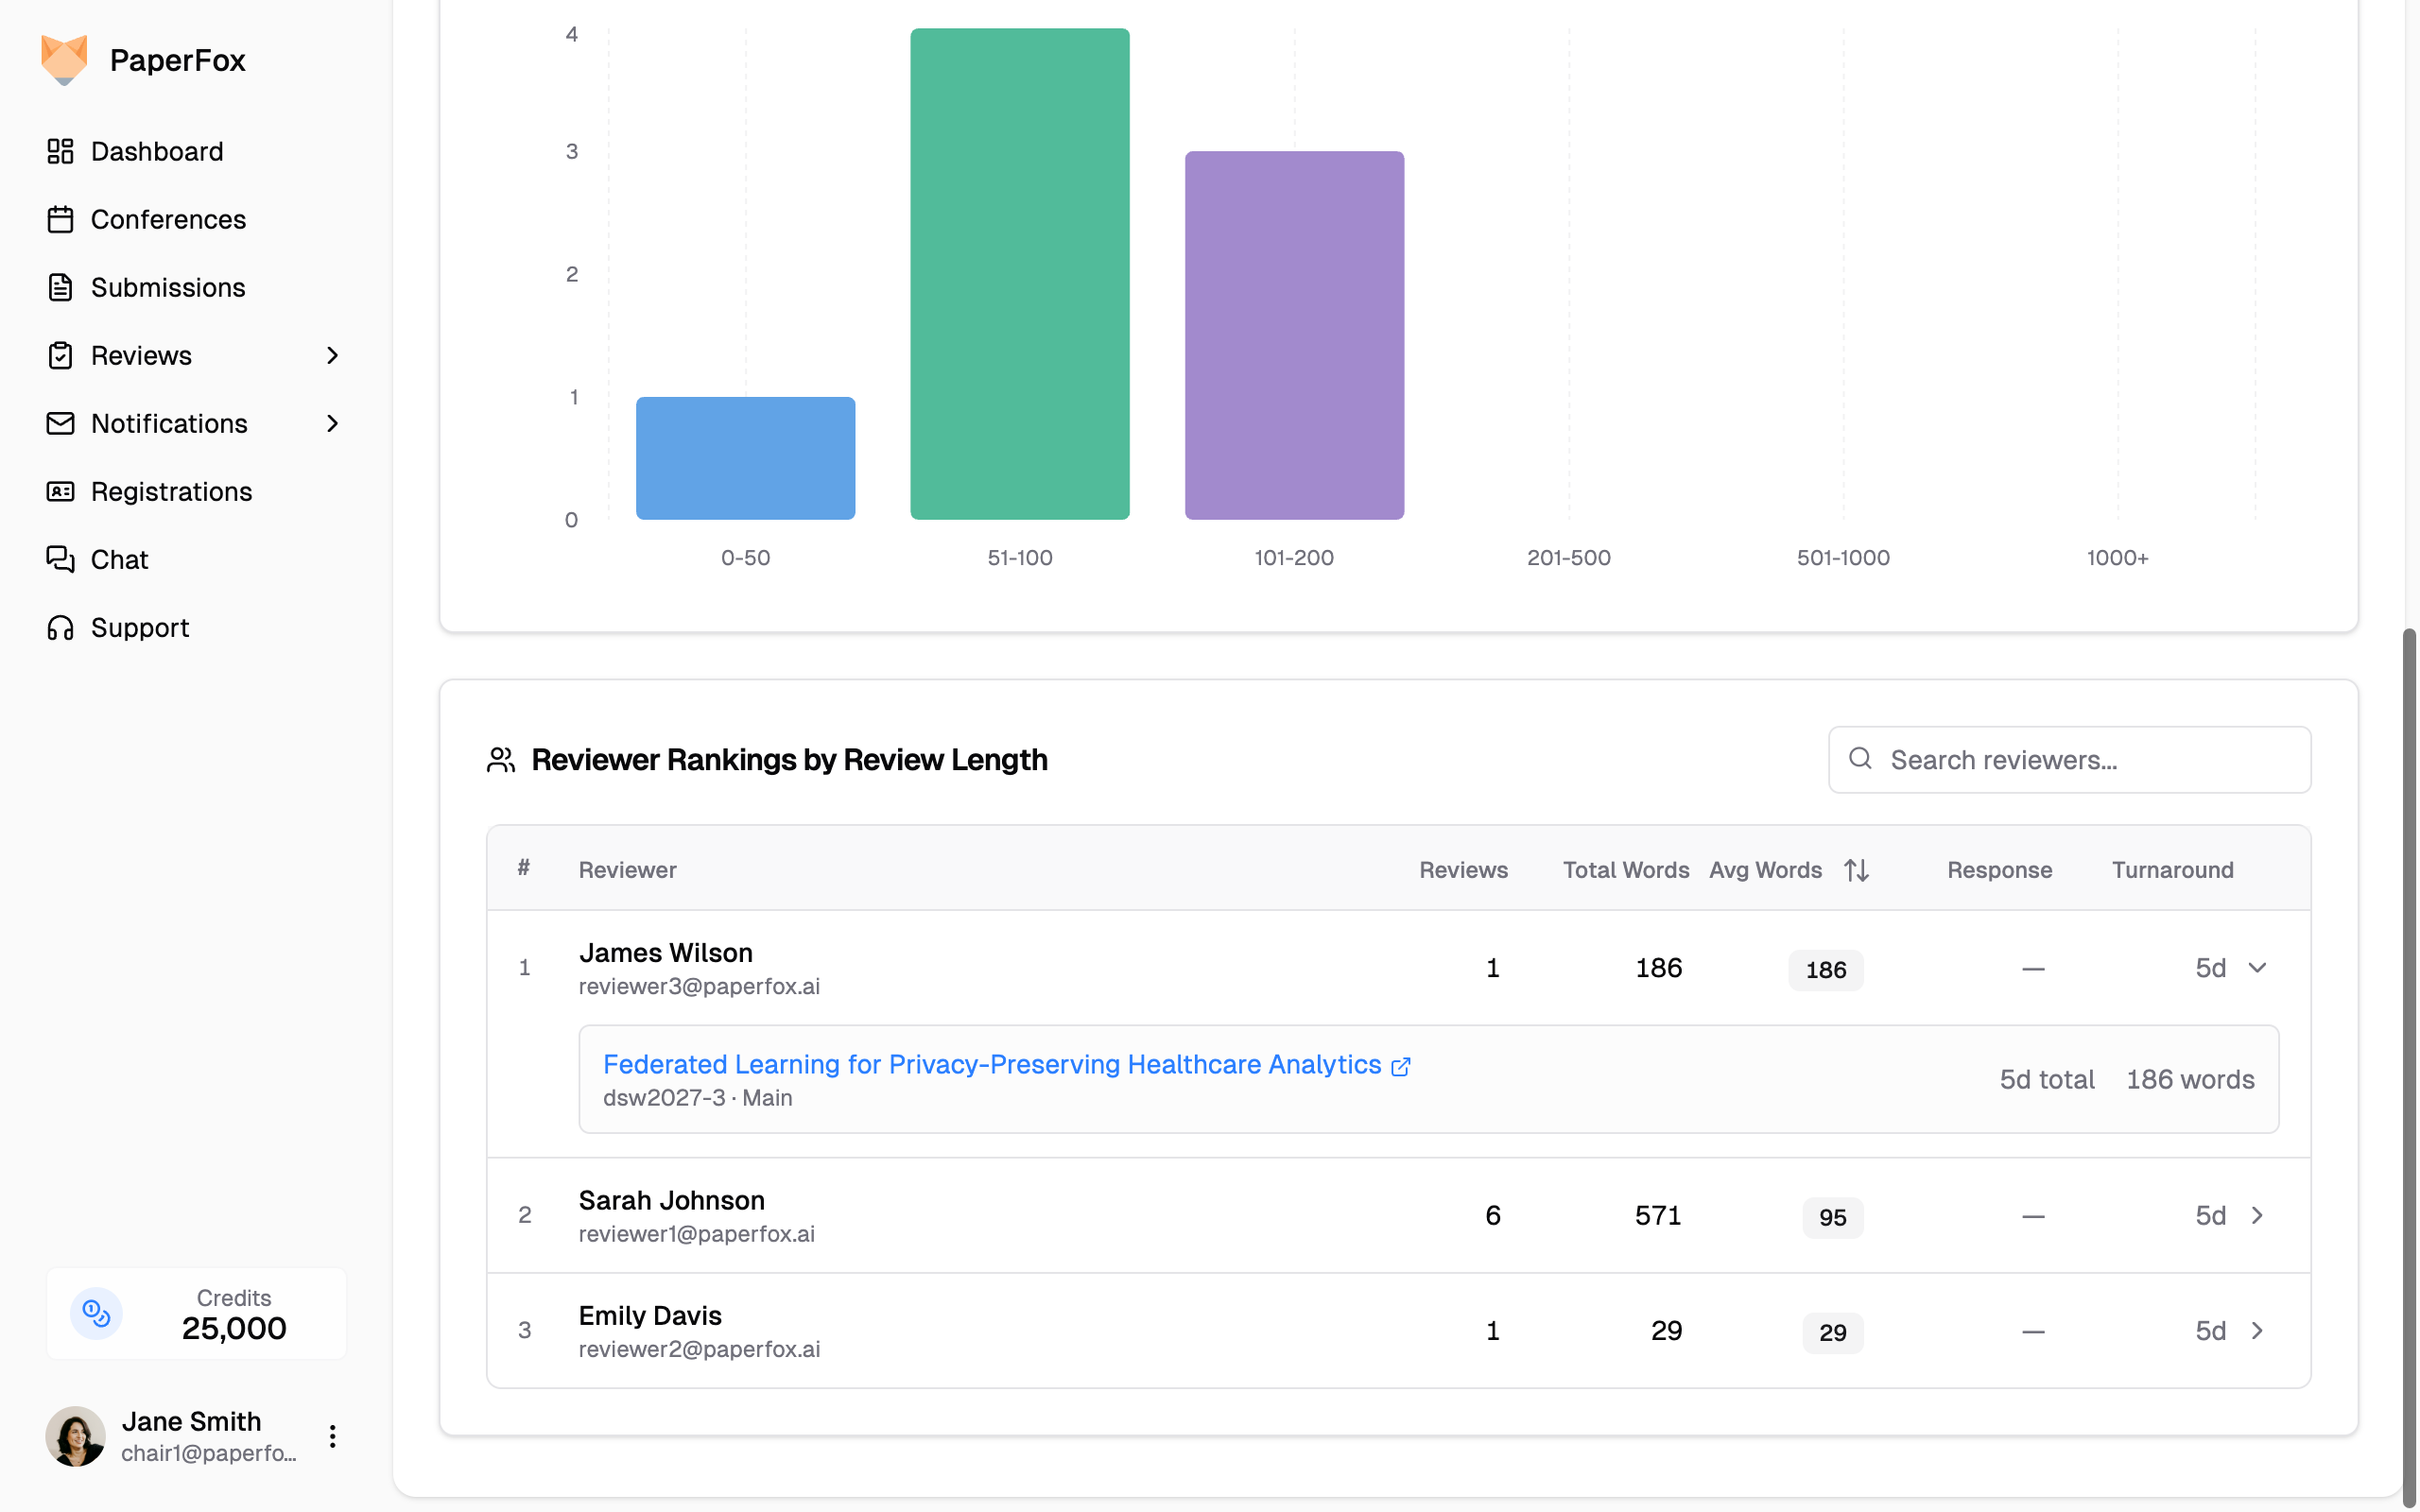
A sortable table ranking reviewers by review length and responsiveness. For each reviewer you can see:
- Reviews — Number of completed reviews
- Total Words — Total word count across all reviews
- Avg Words — Average words per review (highlighted in a badge)
- Response — Average days to accept the assignment
- Turnaround — Average days from assignment to review submission
Click any column header to sort. Use the search box to filter by reviewer name or email.
Click on a reviewer row to expand and see their individual reviews with per-review word counts, time to accept, and total turnaround days.